


By Karrie Karahalios
In the area of Human Computer Interaction (HCI), research in audio is minimal compared to textual and graphical domains. For example, there are many textual and image search engines, yet very few voice browsers for public use. One reason is that a voice or audio browser relies heavily on speech recognition and audio classification that is not very accurate in general use scenarios. Given different speakers and different speaking environments, the problem becomes increasingly difficult. Another reason is that audio is ephemeral; it is difficult to “see”, and, hence, to compare as one would two photographs.
We have decided to take a step back and look at voice from a simpler perspective. Perfect speech recognition is currently out of technical reach. Yet there is still so much that can be learned by looking back at some of the basic parameters: volume, pitch, rate of speech, pause points, and history. Our approach is to computationally visualize voice to provide social cues and feedback that may not be easily perceived in traditional face-to-face interaction. For example, we can see mimicry – the state of mirroring another’s volume and tone to signal allegiance, turn taking, status roles such as leaders and followers in group interaction, etc.
By starting from the beginning and looking at simple vocal features augmented with simple graphics, we create the building blocks for a new visualization tool. This first graphical language resembles musical notation in the sense that it characterizes pitch, volume, and prosody. In our early experiments, we have found that combining these simple parameters has created more intuitive and powerful visualization tools for reflecting on one’s audio than existing state of the art tools that cater to the research elite. As time progresses and users adapt to the existing vocabulary, the building blocks will become more complex.
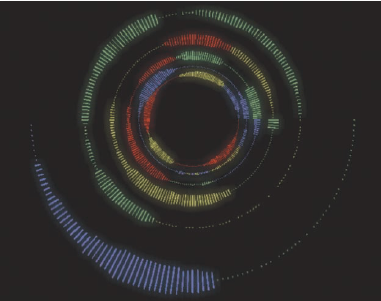
Figure 1. The Conversation Clock visualization. Each participant in the conversation is rendered in a different color.
The length of each rectangle is proportional to the volume captured at that point in time. Dots about the circumference
of each ring imply the table is active, but no one is speaking. Each ring represents one minute of conversation.
The goal is to combine the ease of voice with the visual feedback of graphics to create a new communication medium. In a sense we are creating a graphical language for visualizing communication. Below, I describe one example of this approach with the project Conversation Clock.
The Conversation Clock visualizes aural participation of up to four people around a circular table. The participants at the table wear lapel microphones. Their respective audio is captured by the microphones, transformed into an abstract form, and rendered onto the table via an overhead projector. A snapshot of a Conversation Clock rendering can be seen in Figure 1.
Each person in this visualization is represented by a different color. As a person speaks, his or her audio is visualized as a series of rectangular bars along the periphery of the tabletop. The length of the rectangular bar is proportional to the participant’s spoken volume. That is, the longer the rectangular bar, the louder the audio. If no one is speaking, dots are rendered along the circumference of the ring to indicate that the table is active and capturing audio from the microphones. The most recent conversation is rendered on the outermost ring. Each ring represents one minute of time. As each graphical ring is completed, it animates toward the center of the table and a new ring begins at the outermost edge.
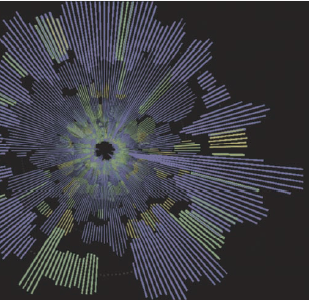
Figure 2. Snapshot of Conversation Clock depicting conversational dominance.
Our initial studies show that the Conversation Clock visualization encouraged balanced participation between the participants. In this study, the participants were graduate students. Specifically, when participants were divided into two categories, above-average speakers and below- average speakers, we found that although above-average speakers took approximately the same number of turns speaking with and without the Conversation Clock visualization, the turns taken using the Conversation Clock were noticeably shorter in length. Below-average speakers took more turns using the Conversation Clock with no noticeable difference in turn-length.
We are not arguing that balanced conversation is ideal conversation. In fact, that is probably not the ideal scenario. We are arguing that “social mirrors” such as the Conversation Clock have an intrinsic power to influence group behavior. This suggests that they should be carefully designed to produce a desired situation.
We are currently running a new series of studies using the Conversation Clock in a social skills club for teenagers diagnosed with Asperger’s Syndrome.
Children with Asperger’s Syndrome (AS), High-Functioning Autism (HFA), non-verbal learning disorder (NVLD), or Pervasive Developmental Delay – Not Otherwise Specified (PDD-NOS) have difficulty with the conversational aspects of social interaction, including turn-taking, interrupting, conversational dominance, length of turn and use of vocal volume for emphasis. Conventional speech and language therapy intervention has focused on remediation by teaching rules for conversational skills, practicing the skills and observing the use of these skills.
Interventions that occur during the conversation allowing for the child to modify a behavior are few. Using the Conversation Clock, children who struggle with social interaction receive real-time feedback and can make immediate adjustments during the conversation.

Figure 3. Common Conversation Clock patters:
(a) concurrent speaking;
(b) delayed turn-taking;
(c) traditional turn-taking;
(d) agreement;
(e) agreement.
Social skills such as turn-taking are subtle social negotiations. Traditional turn-taking as rendered on the Conversation Clock can be seen in Figure 2c. One speaker ramps down his or her volume to allow entry for another speaker. In our longitudinal studies, we are comparing social skills such as turn-taking, interruption, and volume modulation using the Conversation Clock visualization and using traditional social skills therapy. The approach using Conversation Clock and some of our other “social mirrors” for encouraging syllable production and word production in lower functioning children so far appear promising. Parents are enthusiastic about the tools and the children find them engaging. Our future work includes migrating the interfaces to iPhones and toy-like devices so that they can be used in everyday settings.
Karrie Karahalios Ph.D. University of Illinois U.S.A. kkarahal@cs.uiuc.edu
 About Brenda Wiederhold
President of Virtual Reality Medical Institute (VRMI) in Brussels, Belgium.
Executive VP Virtual Reality Medical Center (VRMC), based in San Diego and Los Angeles, California.
CEO of Interactive Media Institute a 501c3 non-profit
Clinical Instructor in Department of Psychiatry at UCSD
Founder of CyberPsychology, CyberTherapy, & Social Networking Conference
Visiting Professor at Catholic University Milan.


